
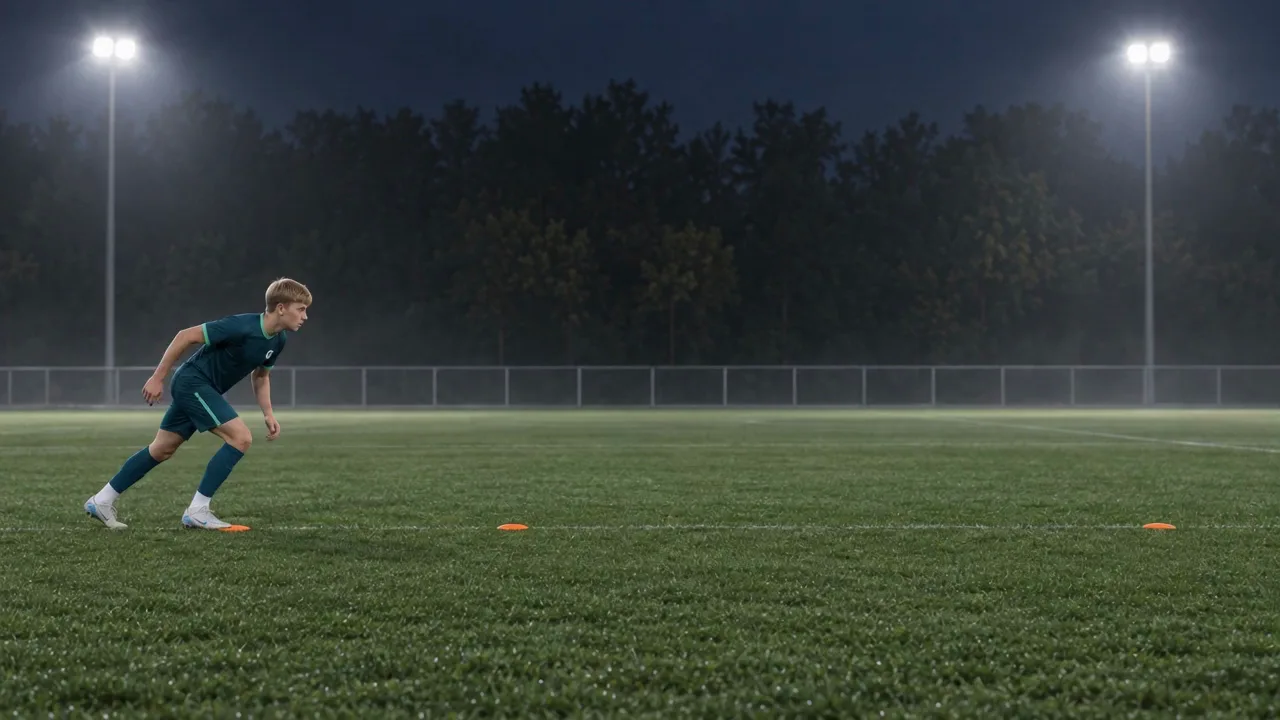
Ten metres decide who gets to the ball first. No wonder the 10 m time gets compared everywhere: in training, at trials, among parents on the touchline. For such a comparison to hold, two things are needed: solid reference values and the same timing method. This article presents the published values from the German FA’s regional talent centres for U11 to U15, separately for boys and girls, puts academy data from other countries into context and shows how to measure so that your number fits the tables.
What a good 10 m time is
The largest published dataset on youth players in Germany comes from the German FA’s (DFB) regional talent centres, the so-called Stützpunkte. Every year thousands of talents run the same photocell sprint test there, in some age groups almost 25,000 players. The median, the time beaten by exactly half of those tested, is 2.18 seconds for U11 boys and drops to 1.96 seconds by U15. For girls it is 2.20 seconds at U11 and 2.03 seconds at U15. The fastest tenth of U13 boys runs 1.96 seconds or faster; at U15 it is 1.83 seconds.
So a time is only good relative to the age group. A U13 player who runs 2.08 seconds sits right in the middle of the talent-centre players. At U11 the same time would be clearly above average, between the 70th and the 90th percentile.
Two caveats belong to every one of these numbers. First, talent-centre players are already selected. The median of an ordinary club team is therefore probably slower; there is no solid figure for grassroots football in Germany or Austria. Second, the values only apply to the DFB’s timing method. Measure differently and you can be off by tenths of a second, which is more than a player gains in speed over two years.
DFB benchmarks by age group and sex
The following values come from the performance testing manual that the DFB publishes together with the University of Tübingen, in the version of February 2022. They summarise the results of the most recent five autumn test rounds. At the talent centres, one DFB age group equals exactly one birth year. The tables show mean and standard deviation (SD), five percentiles and the number of players tested.
The percentiles follow the manual’s logic: a high percentile stands for a better performance. The 90th percentile (P90) is the time only the fastest tenth reaches or beats. From the 10th percentile (P10) onwards, the slowest tenth begins. The manual lists the 30th and 70th percentiles, so those two appear in the table.
| Age group | Mean ± SD | P10 | P30 | Median | P70 | P90 | Tested |
|---|---|---|---|---|---|---|---|
| U11 | 2.19 ± 0.11 | 2.33 | 2.24 | 2.18 | 2.13 | 2.05 | 6,165 |
| U12 | 2.14 ± 0.11 | 2.28 | 2.19 | 2.13 | 2.08 | 2.00 | 24,812 |
| U13 | 2.08 ± 0.10 | 2.22 | 2.13 | 2.08 | 2.03 | 1.96 | 21,177 |
| U14 | 2.02 ± 0.11 | 2.16 | 2.07 | 2.02 | 1.97 | 1.89 | 14,621 |
| U15 | 1.96 ± 0.10 | 2.09 | 2.01 | 1.96 | 1.90 | 1.83 | 8,898 |
Source: DFB/University of Tübingen, performance testing manual (2022), pp. 24–25. Infrared photocells, split-stance start without a signal, best of two trials.
| Age group | Mean ± SD | P10 | P30 | Median | P70 | P90 | Tested |
|---|---|---|---|---|---|---|---|
| U11 | 2.20 ± 0.10 | 2.33 | 2.25 | 2.20 | 2.14 | 2.07 | 266 |
| U12 | 2.16 ± 0.11 | 2.30 | 2.21 | 2.16 | 2.10 | 2.02 | 1,403 |
| U13 | 2.10 ± 0.10 | 2.23 | 2.16 | 2.10 | 2.05 | 1.97 | 1,488 |
| U14 | 2.06 ± 0.10 | 2.18 | 2.10 | 2.06 | 2.01 | 1.94 | 1,226 |
| U15 | 2.03 ± 0.10 | 2.16 | 2.08 | 2.03 | 1.98 | 1.91 | 836 |
Source: as above, pp. 26–27. Fewer than 1,000 players took part at U11 and U15. The DFB describes values based on so few players as not yet stable.
How to read the tables
An example: a U13 boy runs 2.10 seconds. That is slightly slower than the median of 2.08 seconds and faster than the 30th percentile of 2.13 seconds, which puts him in the broad middle of the talent-centre players in his age group. At 1.96 seconds he would belong to the fastest tenth. The gaps are small: between the 30th and 70th percentiles there are only 0.09 to 0.11 seconds in every age group. Hundredths separate the middle from the top, and that is exactly why every inaccuracy in measurement carries so much weight.
Who was tested matters as well. The DFB talent centres support preselected talents one level below the professional youth academies (NLZ). Using the tables as a yardstick for an ordinary club team therefore sets the bar rather high. Players who later make it into an academy, on the other hand, are clearly ahead again. In a nationwide analysis by Oliver Höner and colleagues (2021), the players who belonged to an academy three years later were on average 0.15 to 0.17 seconds faster over 20 metres at U12 to U14 than the average of all talent-centre players. That difference is our own calculation from the published means of both sources.
Age within the birth year adds to this. A child born in December can be almost a year younger than a teammate born in January, and during puberty physical maturity counts on top. The standard deviation of the DFB values is 0.10 to 0.11 seconds, roughly what the median gains in two years (our own calculation from the tables). A late developer can therefore sit one standard deviation behind the median and still be just as well trained as his teammates. The fairer comparison is with oneself, as described in the article Documenting player development.
Why times from different tests do not match
The DFB tables apply to a precisely defined procedure: three infrared photocells at 0, 10 and 20 metres, a split-stance start with the front foot on the line, no start signal. The clock only starts when the player breaks the first beam. Players run two trials, the better one counts, with five metres to run out. Reaction time is therefore not part of the time at all, and the very first push from standing only partly.
Other studies measure differently, and that shifts the numbers more than any age difference. An example from the same age group: Spanish U16 players whose run was analysed on video from the first movement averaged 2.48 seconds (García-Pinillos and colleagues, 2014). U16 players at the Aspire Academy in Qatar ran 1.80 seconds with photocells and a start half a metre behind the gate (Mendez-Villanueva and colleagues, 2011). That is a gap of 0.68 seconds, a good three times as much as the DFB median improves between U11 and U15 in total. Part of it is a genuine difference in level, since the Aspire players belong to the academy elite and the Spanish players to the sub-elite. In our assessment, though, the method explains the larger part: measuring from the first movement counts the slowest phase of the sprint in full.
The start distance counts too. A player who starts half a metre to one metre behind the first photocell is already moving when it triggers. The research literature puts the advantage over a true standing start, where the first movement triggers the clock, at around 0.1 to 0.2 seconds. The studies evaluated here did not measure this themselves, so the figure is an estimate. With a flying start the effect grows further: Spanish club players at U11 and U12 ran 2.08 and 2.01 seconds with a two-metre run-up before the first marker (Callejas Rosales and colleagues, 2026). On paper that would make them faster than the median of the German talent-centre players, although they come from an ordinary club sample.
In practice this means: only compare a time with values recorded with the same starting stance, the same start distance and the same timing. The following table shows published values from other countries with their respective protocols. They show orders of magnitude and can only be compared with each other and with the DFB values to a limited extent.
| Group | Time | Tested | Level | Timing | Source |
|---|---|---|---|---|---|
| U11 boys, Spain | 2.08 ± 0.10 | 21 | club | video, 2 m flying start | Callejas Rosales 2026 |
| U12 boys, Spain | 2.01 ± 0.07 | 21 | club | video, 2 m flying start | Callejas Rosales 2026 |
| U13 boys, Croatia | 2.00 ± 0.14 | 29 | two academies in Split | photocells, start 1 m behind the line | Krolo 2020 |
| U15 boys, Croatia | 1.88 ± 0.14 | 30 | two academies in Split | photocells, start 1 m behind the line | Krolo 2020 |
| U14 boys, Qatar | 1.93 ± 0.11 | 14 | Aspire Academy | photocells, start 0.5 m behind | Mendez-Villanueva 2011 |
| U16 boys, Qatar | 1.80 ± 0.06 | 22 | Aspire Academy | photocells, start 0.5 m behind | Mendez-Villanueva 2011 |
| U18 boys, Qatar | 1.73 ± 0.06 | 25 | Aspire Academy | photocells, start 0.5 m behind | Mendez-Villanueva 2011 |
| U16 boys, Spain | 2.48 ± 0.24 | 18 | sub-elite | video from first movement | García-Pinillos 2014 |
| U18 boys, Spain | 2.43 ± 0.19 | 18 | sub-elite | video from first movement | García-Pinillos 2014 |
| 14-year-old boys | 2.14 ± 0.11 | 29 | elite club | photocells, start 0.5 m behind | Silva 2022 |
| 16-year-old boys | 2.04 ± 0.09 | 27 | elite club | photocells, start 0.5 m behind | Silva 2022 |
| 18-year-old boys | 1.79 ± 0.10 | 12 | elite club | photocells, start 0.5 m behind | Silva 2022 |
| U12 girls, England | 2.06 ± 0.13 | 30 | FA talent programme | photocells, start 0.5 m behind | Emmonds 2018 |
| U14 girls, England | 2.04 ± 0.13 | 31 | FA talent programme | photocells, start 0.5 m behind | Emmonds 2018 |
| U16 girls, England | 1.97 ± 0.14 | 32 | FA talent programme | photocells, start 0.5 m behind | Emmonds 2018 |
Level and timing method differ from row to row, and each group comprises only 12 to 32 players. They cannot be combined into a single ranking.
How the 10 m time develops with age
Between U11 and U15 the boys’ median gets 0.05 to 0.06 seconds faster every year, 0.22 seconds in total. For girls it is 0.03 to 0.06 seconds per year and 0.17 seconds in total. Up to U13 both curves run close together over 10 metres, with 0.02 to 0.03 seconds between the medians. At U14 the gap is 0.04 and at U15 already 0.07 seconds. Over 20 metres, where running speed counts for more, the gap opens further: from 0.03 seconds at U11 to 0.15 seconds at U15. All of these gaps are our own calculations from the DFB tables.
The 20 m times from the same DFB test also show how far ahead the later academy players are. There is no median for them; the Höner study reports means.
| Age group | Boys, median | Girls, median | Later in an academy, mean |
|---|---|---|---|
| U11 | 3.78 | 3.81 | – |
| U12 | 3.68 | 3.72 | 3.54 |
| U13 | 3.58 | 3.61 | 3.43 |
| U14 | 3.46 | 3.53 | 3.29 |
| U15 | 3.32 | 3.47 | 3.23 |
Sources: DFB performance testing manual (2022), pp. 24–27; Höner et al. (2021), Table 3, boys who belonged to an academy three years later, 582, 356, 202 and 58 players at U12 to U15.
From U16: values from academies
For older age groups there is no comparably large dataset. Academies provide smaller samples, each with its own protocol. At Aspire, the 10 m means fell from 1.93 seconds at U14 to 1.80 seconds at U16 and 1.73 seconds at U18. In an elite club studied by Silva and colleagues in 2022, the 14-year-olds ran 2.14 seconds, the 15- and 16-year-olds 2.04 seconds and the 17- and 18-year-olds 1.81 and 1.79 seconds. Jumps between single age groups should be read with caution in groups this small; a handful of particularly fast players is enough to shift the mean.
What coaches and parents should take from these curves is mainly calm. Progress comes in spurts, and if a child stands still for a while during a growth phase, that phase may well be the reason. Load tolerance changes during this time too, more on that in the article Youth football injuries.
How to measure 10 metres properly
A clean test needs little equipment but fixed rules. Measure the distance with a tape measure, because counting steps is not precise enough for hundredths. Mark start and finish with cones or lines and leave room to run out behind the finish; the DFB allows five metres. Test on a flat, dry surface, ideally always on the same pitch in the same shoes. Artificial turf, grass and indoor floors all run differently.
For the start, it pays to adopt the DFB procedure: split stance, front foot on the line, standing still, and the player sets off when ready. With a start signal you also measure reaction time. What matters most is that starting stance and start distance stay the same for every test. A player who starts a step behind the line next time is running a different test.
Run two trials with full recovery in between, the better one counts, just as the DFB manual prescribes. A single trial is vulnerable to a botched start, and with many trials in a row you eventually measure fatigue as well. Before the first trial comes a complete warm-up with easy jogging, running drills and a few build-up runs close to top speed. In winter it can take longer. Which tests are worth doing during winter preparation at all is covered in the article Athletic testing in winter.
Write down how every time came about: date, pitch, surface, shoes, starting stance, start distance and timing device. With these details you will still know a year from now whether a better time was real progress or a different setup. Judge changes across several test dates. A single measurement fluctuates with daily form, weather and sleep, while a trend across several test days is far more reliable. Hand timing is too coarse for 10 metres, because the timekeeper reacts late when pressing the button and the differences here are hundredths.
What can be trained in acceleration
Acceleration over the first metres can be trained, but it changes slowly and in youth players depends heavily on growth. A few principles have proven themselves in practice. No specific improvement can be promised to anyone on that basis.
Sprints need full intensity and full rest. Short, maximal accelerations with enough recovery train acceleration, while tired sprints mainly train endurance. Vary the starting positions in training: from standing, from running backwards, after a turn, on a signal. In a match hardly anyone starts from a perfect split stance. For the test, by contrast, the start always stays the same.
Strength and jumping ability are part of it. Jumps, bounding and, in youth, bodyweight exercises develop the ability to apply force to the ground quickly. As players get older, supervised strength training is added. With younger players it is worth looking at the technique of the first steps: forward lean, a strong arm drive and active foot contacts.
Sprints are intense and belong in a weekly plan that balances load and recovery. How a club can manage this without much effort is described in our guide Training management in a football club. If pain occurs, for example in the knee, heel or hip during a growth phase, a break and, where appropriate, medical advice come before any further sprint test.
How Gearstack FC measures the 10 metres
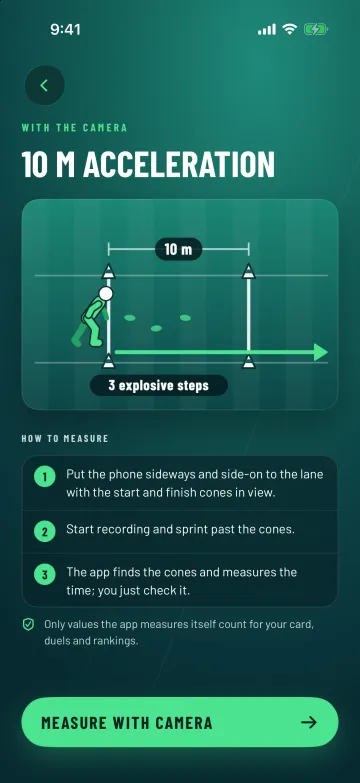
Gearstack FC is our football app for players and is coming soon to the App Store and Google Play. It measures 10 m acceleration with a smartphone. During setup the app shows where the two cones and the phone go; two cones and 10 metres of space are all it takes. Then come three steps: align, mark, record. The app waits until the smartphone is level, steady and in landscape, films in slow motion and detects when the player crosses the lines.
The time starts when the hip crosses the start line and stops when the player crosses the 10 m line. That comes close to the DFB procedure, where the clock starts when the player breaks the start beam. Because timing only begins at the start line, the reaction to a start signal does not count either.
The two methods are still not identical. A photocell reacts to the first body part that breaks the beam, the app to the hip. No source we know of quantifies this difference, and a comparison of app times against photocells is still pending. Until then, the DFB values in this article are a point of orientation and no rating by the app. The app mainly compares you with yourself: your player card, duels and leaderboards only count values the app measured itself. That way, all the times you put side by side come from the same method. More about the app and all tests on the Gearstack FC page.
Where the numbers come from and what is still missing
This article reflects the state of 16 October 2026. All numbers come from the sources linked below, the DFB values from the February 2022 version of the testing manual. Where we did our own calculations, for example for the gaps between age groups, the text says so, and estimates are marked as such.
Some gaps remain. In our research we found no public age-group values from the Austrian FA, Austrian academies or major Spanish and Croatian clubs. There are hardly any published values for children under eleven and for female players over 16. This article deliberately leaves out adult amateur players, whose values come from other studies with their own protocols. As soon as the comparison of the app against photocells is available or the DFB publishes new norm tables, we will revise this article and note the date.
Questions from the touchline
- My son runs 2.30 seconds at U12. Is that slow?
- Compared with the DFB talent centres, yes: the 10th percentile for U12 boys is 2.28 seconds, so more than nine out of ten tested talents were faster. Two things put this into perspective. Talent-centre players are preselected, and a time from a different timing method can differ by tenths. What says more is how your son’s time develops from test to test, always measured the same way.
- From what time is a child considered fast over 10 metres?
- By the DFB yardstick, reaching the 70th percentile puts a player among the fastest 30 percent, and reaching the 90th percentile among the fastest tenth. For U13 boys that is 2.03 and 1.96 seconds, for U13 girls 2.05 and 1.97 seconds. These thresholds apply to the DFB procedure with photocells and a free start from a split stance.
- Do girls and boys run equally fast up to U15?
- Over 10 metres almost: up to U13 the medians are 0.02 to 0.03 seconds apart, at U15 the gap is 0.07 seconds. Over 20 metres it grows to 0.15 seconds by U15. From U13 onwards it is therefore worth assessing boys and girls separately.
- Can I compare a time from Gearstack FC with the DFB values?
- As a rough orientation, yes, because like the DFB the app only starts the clock when the start line is crossed. A comparison against photocells is still pending, so an exact placement in the percentiles remains open. Your own times from the app are reliably comparable with each other.
- How often should the 10 m sprint be tested?
- A few fixed dates are enough, for example at the start and end of pre-season and once during the season. The DFB norm values come from tests in autumn. More frequent tests mainly show daily form.
For clubs: Eleven players, eleven readiness scores
Sources
- DFB und Universität Tübingen: Testmanual Leistungsdiagnostik, Normwerttabellen S. 24–27 (Februar 2022)
- Höner O. et al.: Nationwide subjective and objective assessments of potential talent predictors in elite youth soccer (Frontiers in Sports and Active Living 2021)
- Mendez-Villanueva A. et al.: Age-related differences in acceleration, maximum running speed, and repeated-sprint performance in young soccer players (Journal of Sports Sciences 2011)
- Krolo A. et al.: Agility Testing in Youth Football (Soccer) Players (IJERPH 2020)
- García-Pinillos F. et al.: Análisis del rendimiento en salto vertical, agilidad, velocidad y velocidad de golpeo en jóvenes futbolistas (Apunts Medicina de l’Esport 2014)
- Callejas Rosales R. et al.: Exploring differences in body composition and physical fitness between U11 and U12 soccer players (SPORT TK 2026)
- Silva A. F. et al.: Variations of the Locomotor Profile, Sprinting, Change-of-Direction, and Jumping Performances in Youth Soccer Players (IJERPH 2022)
- Emmonds S. et al.: Seasonal changes in the physical performance of elite youth female soccer players (Journal of Strength and Conditioning Research 2018, Autorenfassung)
Gearstack FC
10 metres, two cones, one phone
Gearstack FC measures acceleration, jumping, agility, endurance and technique with your smartphone and shows how your values develop from test to test. The app is coming soon to the App Store and Google Play.
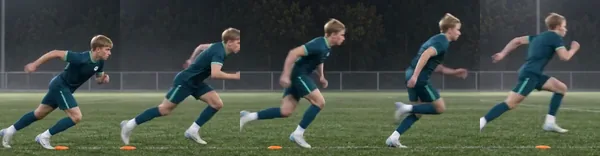
Image: sample data, fictional AI-generated player.

Gearstack Health is a wellness and prevention product, not a medical device. This text does not replace medical diagnosis, treatment or emergency care.
AI-assisted, reviewed by Kristijan Bezjak, founder of Gearstack.